See More. Do More. With WIZREAL.
Become a WIZREAL member to access full property details, save your favourites, and enjoy a smarter way to buy, sell, or explore — with expert support every step of the way.

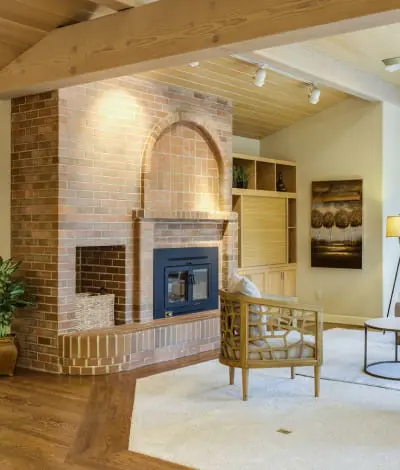
Luxury 2-Storey Condo Townhome in Iconic M City III - Downtown Mississauga Experience the space and privacy of a multi-level home paired with effortless, maintenance-free condominium living. Situated in Mississauga's landmark M City III community, this contemporary two-storey townhome blends architectural style with warm, functional design. Residence Highlights Open-Concept Main Living: Soaring ~9-foot smooth ceilings and wide-plank laminate flooring anchor a bright, flowing living and dining space built for everyday comfort and entertaining.* Gourmet Kitchen: Outfitted with sleek custom cabinetry, durable stone countertops, a stylish tile backsplash, and integrated stainless steel appliances.* Private Retreats & Spa Baths: Generously sized bedrooms paired with spa-inspired bathrooms featuring designer vanities, stone counters, porcelain tilework, a frameless glass shower, and a deep soaker tub.* Everyday Convenience: Complete with in-suite stacked laundry for seamless day-to-day living. Resort-Calibre Building Amenities Enjoy full access to M City III's extensive indoor and outdoor lifestyle spaces:* Wellness & Fitness: Indoor swimming pool opening directly onto an outdoor sundeck, a fully equipped fitness centre, and a dedicated yoga/spin studio.* Social & Family: Resident party room, private screening theatre, kids' play zone, and landscaped outdoor lounges with BBQ stations.* Peace of Mind: 24-hour concierge and security. Prime City Centre Location Walkable Lifestyle: Steps from Square One Shopping Centre, Celebration Square, Sheridan College, dining, and entertainment.* Effortless Transit: Immediate access to major transit hubs and the Hurontario LRT line right at your doorstep.A rare opportunity to lease a modern, multi-level townhome in the heart of Mississauga's most sought-after master-planned community.
With a 20% down payment of $640, your estimated payment is:
Listing history of 448 Burnhamthorpe Road-479(TH-7) over time.
Explore the comprehensive details and unique features that make this property special.
Review the dimensions and specific features of each room.
| Room | Dimensions | Features |
|---|---|---|
| Dining Room | 17.29 x 11.38 ft 5.27 x 3.47 m | |
| Kitchen | 17.29 x 11.38 ft 5.27 x 3.47 m | |
| Bedroom 3 | 9.88 x 8.20 ft 3.01 x 2.50 m |
4 Pc Bath
|
| Living Room | 17.29 x 11.38 ft 5.27 x 3.47 m |
| Room | Dimensions | Features |
|---|---|---|
| Primary Bedroom | 12.14 x 9.19 ft 3.70 x 2.80 m |
4 Pc Ensuite
|
| Bedroom 2 | 9.51 x 8.53 ft 2.90 x 2.60 m | |
| Family Room | 16.47 x 7.22 ft 5.02 x 2.20 m |
Explore local context, amenities, and market signals around this property.
Explore the neighborhood and see exactly where this property is located.
Schools serving this address, closest first. Scores are the Repliers rating out of 10.
Green space, playgrounds and recreation within easy reach of this property.
Police, fire and emergency services nearest to this address.
Bus, subway and rail stops nearby, ordered by walking distance.
This pie chart visualizes the average market value for different property categories (e.g., Detached, Condo, Townhouse) in this area. Each slice represents a property type, and the size of the slice corresponds to its average sold price relative to the others. Use this to quickly identify which property types command premium prices versus more affordable options. If the chart is dominated by one large slice, it indicates a significant price gap between that luxury property type and the rest of the market.
Estimate your monthly payments and find a financing plan that works for you.
Your Calculated Payment
Comparison of listing prices over time. Each bar represents the average list price for that month. Use this chart to understand how the market's average asking price has trended recently. Each bar represents a price range, and the height indicates how many active listings fall within that range. Use this to see if this property's asking price is competitive, above, or below the market average. A higher concentration of bars around the current property's price suggests it's priced in line with comparable listings.
This chart reveals market trends by combining two key metrics: The red line shows the median sold price per month, indicating whether property values are rising or falling over time. The green bars represent the average number of days properties stayed on the market before selling. Shorter bars indicate a hot market where properties sell quickly, while taller bars suggest a slower market. Together, these help you understand market momentum and pricing power.
This content is exclusive for our members. Please log in or sign up to unlock full access.
Login to View ContentDon't have an account? Sign Up Now

Become a WIZREAL member to access full property details, save your favourites, and enjoy a smarter way to buy, sell, or explore — with expert support every step of the way.
One platform. Endless potential. Tailored tools for every player in the real estate ecosystem.
Whether you're building your brand or scaling your business, WIZREAL gives you the edge.
Learn More
See all the listings after you log in
Don't have an account? Sign up