See More. Do More. With WIZREAL.
Become a WIZREAL member to access full property details, save your favourites, and enjoy a smarter way to buy, sell, or explore — with expert support every step of the way.
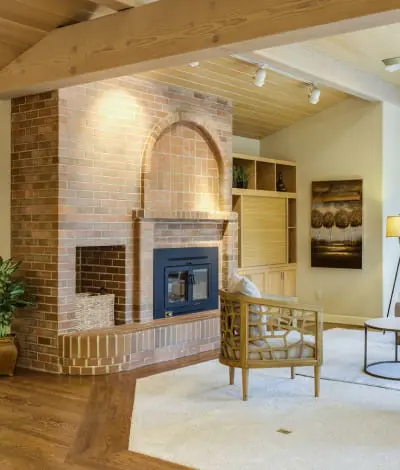
Hey Harold, word on the street is you're back on the market. Single, available, and no more tenants or roommates crowding the place. I didn't want to waste any time, so I came by to see you today, and I have to say I really enjoyed it. I don't want to come on too strong, but I can't stop thinking about you, and I felt the connection the moment you invited me in. The way your main level is laid out is so cute and charming. I loved the warm flooring, the updated kitchen (that pantry!) and the way everything flows out to the backyard. That deck? I could've spent hours out there under the trees with you. With no one else around, I could really see how much room you've got. The space just stretches out. And that bathroom! The walk-in shower is straight-up steamy. Can we talk about your sideways staircase up to the bedrooms? It reminded me of a place I used to hang out at in the Beaches, which is funny, since people call Mimico "The Beaches West." The bedrooms were a great size, full of natural light and storage, and those vaulted ceilings sealed the deal. I'll admit you're hard to read. You're the strong, silent type with a quiet confidence. I kept thinking about you after I left, while I grabbed a sandwich at Sanremo and found out there's a Jimmy's Coffee right around the corner. I had a lot to think about on the short GO ride downtown. So if you're up for seeing me again, hit me back. We could walk down by the lake or check out the nearby parks, though I hear it's hard to get you moving since you're... well... a house. You've got me thinking a lot more about Mimico, and about making a move there, if that's not too forward. Someone like you doesn't stay single for long, so let's not wait. Talk soon, I hope.
With a 20% down payment of $159,600, your estimated payment is:
Listing history of 53 Harold Street over time.
Explore the comprehensive details and unique features that make this property special.
Review the dimensions and specific features of each room.
| Room | Dimensions | Features |
|---|---|---|
| Living Room | 10.50 x 13.12 ft 3.20 x 4.00 m |
Window
|
| Kitchen | 10.17 x 13.12 ft 3.10 x 4.00 m | |
| Dining Room | 8.53 x 5.25 ft 2.60 x 1.60 m |
| Room | Dimensions | Features |
|---|---|---|
| Bedroom 2 | 10.83 x 13.12 ft 3.30 x 4.00 m | |
| Primary Bedroom | 10.17 x 13.12 ft 3.10 x 4.00 m |
Explore local context, amenities, and market signals around this property.
Explore the neighborhood and see exactly where this property is located.
Schools serving this address, closest first. Scores are the Repliers rating out of 10.
Green space, playgrounds and recreation within easy reach of this property.
Police, fire and emergency services nearest to this address.
Bus, subway and rail stops nearby, ordered by walking distance.
This pie chart visualizes the average market value for different property categories (e.g., Detached, Condo, Townhouse) in this area. Each slice represents a property type, and the size of the slice corresponds to its average sold price relative to the others. Use this to quickly identify which property types command premium prices versus more affordable options. If the chart is dominated by one large slice, it indicates a significant price gap between that luxury property type and the rest of the market.
Estimate your monthly payments and find a financing plan that works for you.
Your Calculated Payment
Estimate the land transfer tax or registration fees due when you close on this home.
Total Land Transfer Tax
Comparison of listing prices over time. Each bar represents the average list price for that month. Use this chart to understand how the market's average asking price has trended recently. Each bar represents a price range, and the height indicates how many active listings fall within that range. Use this to see if this property's asking price is competitive, above, or below the market average. A higher concentration of bars around the current property's price suggests it's priced in line with comparable listings.
This chart reveals market trends by combining two key metrics: The red line shows the median sold price per month, indicating whether property values are rising or falling over time. The green bars represent the average number of days properties stayed on the market before selling. Shorter bars indicate a hot market where properties sell quickly, while taller bars suggest a slower market. Together, these help you understand market momentum and pricing power.
This content is exclusive for our members. Please log in or sign up to unlock full access.
Login to View ContentDon't have an account? Sign Up Now

Become a WIZREAL member to access full property details, save your favourites, and enjoy a smarter way to buy, sell, or explore — with expert support every step of the way.
One platform. Endless potential. Tailored tools for every player in the real estate ecosystem.
Whether you're building your brand or scaling your business, WIZREAL gives you the edge.
Learn More
See all the listings after you log in
Don't have an account? Sign up